

Why we built a backtester for dollar cost averaging
Why we built a backtester for dollar cost averaging
We decided to expand our number crunching to virtual portfolios to make it easier to see the power of small recurring investments.

Share is built around recurring investments and dollar-cost averaging. We think it’s the easiest way for busy people to invest. But one challenging thing about recurring investments is it can be difficult to picture how they’ll perform, even looking backwards. Investing $20 a week may not seem like much, and because the price of your investments fluctuates every single week, it’s not that easy to imagine how your investment would have done.
If you’re familiar with any sort of investing product, you’ve surely seen something like the screenshot below.
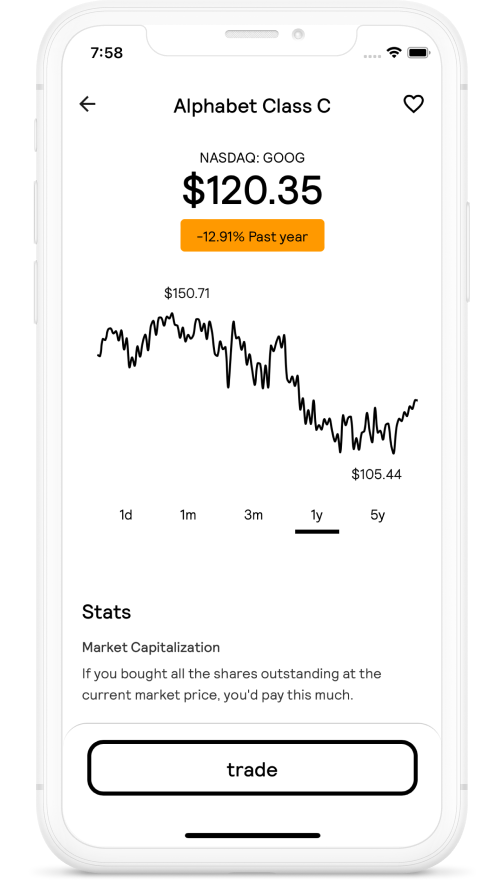
It shows the changes in Google’s stock price over a year. It’s relatively easy to figure out how your investment would have done. If you invested $1,000 in Google a year ago, claims the screenshot, you’d have about $870 today. But how likely are you to have invested $1,000 exactly a year ago? If you had invested $1,000 in Google 5 years ago, at the time of this writing you’d have about $2,500. So obviously, when you invest is critical and your returns are very sensitive to when you enter the market, if you enter the market all at once.
Recurring investments are different. Say you invest in Google every single week, a little bit at a time - if you invested $20 a week in Google for the past year, what would your result be? Hard to say, since the screenshot above isn’t much help. It seems like you’d be down, since the line is going down, but by how much?
Turns out, you’d still have almost all of your $1,040. See below, or try it for yourself here.

If you’re good at math, you might be able to intuit how your recurring investment would perform when you look at one stock, but what about 3 stocks?

Say you take your $20 weekly investment, and split it evenly between all three of these stocks. So about $6.67 to each one each week, for 52 weeks. Unless you’re a math genius, it’s very difficult to intuit the performance of this investment. Since Apple and Google are about equally up and down for the year, maybe they cancel each other out. So I’m gonna guess it will be net down, since Snowflake is way down. Let’s test it. Again, you can try it for yourself here.
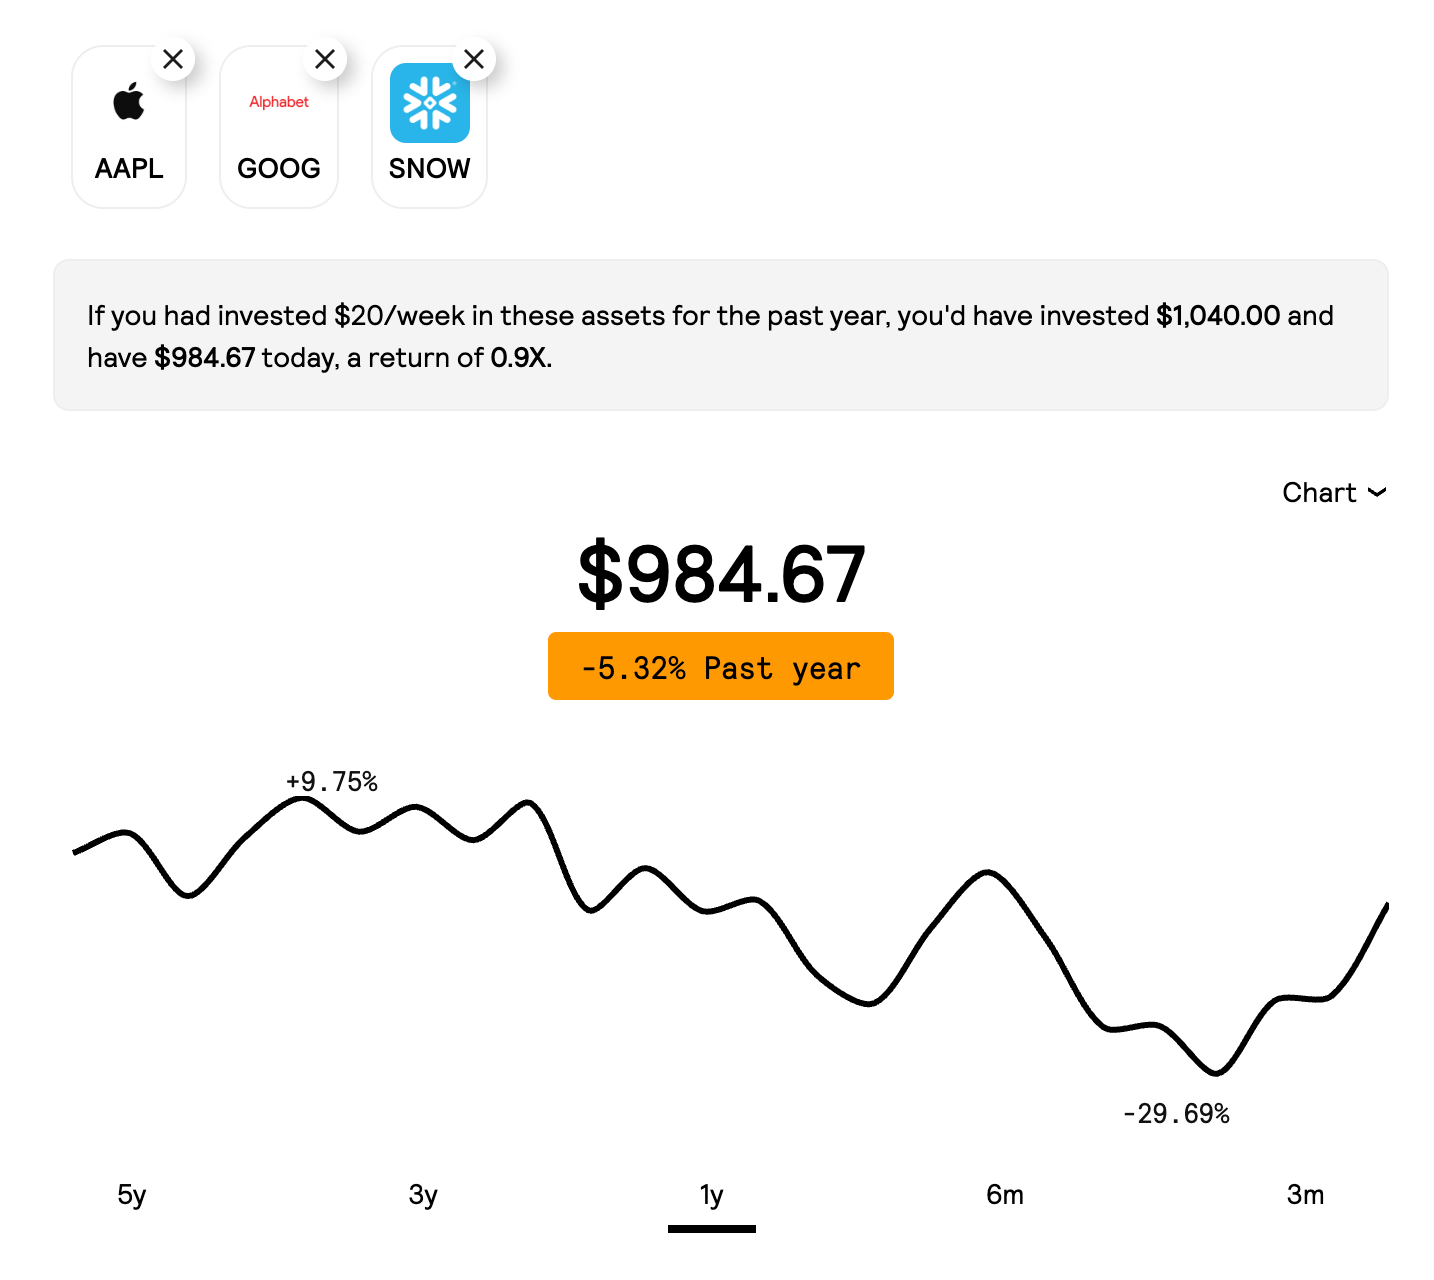
Turns out, it’s almost exactly the same as Google alone! That’s surprising. But if you look a little closer, you can see that Snowflake is almost a mirror image of itself - it spent half the year up, and the other half down. Since we bought all year long, we averaged out the up half with the down half. Apple is similar, it spent almost as much time down as it did up. So it actually makes sense that our return is similar to Google alone.
Of course, you can have even bigger portfolios, and longer time periods. Like 12 stocks over 5 years.
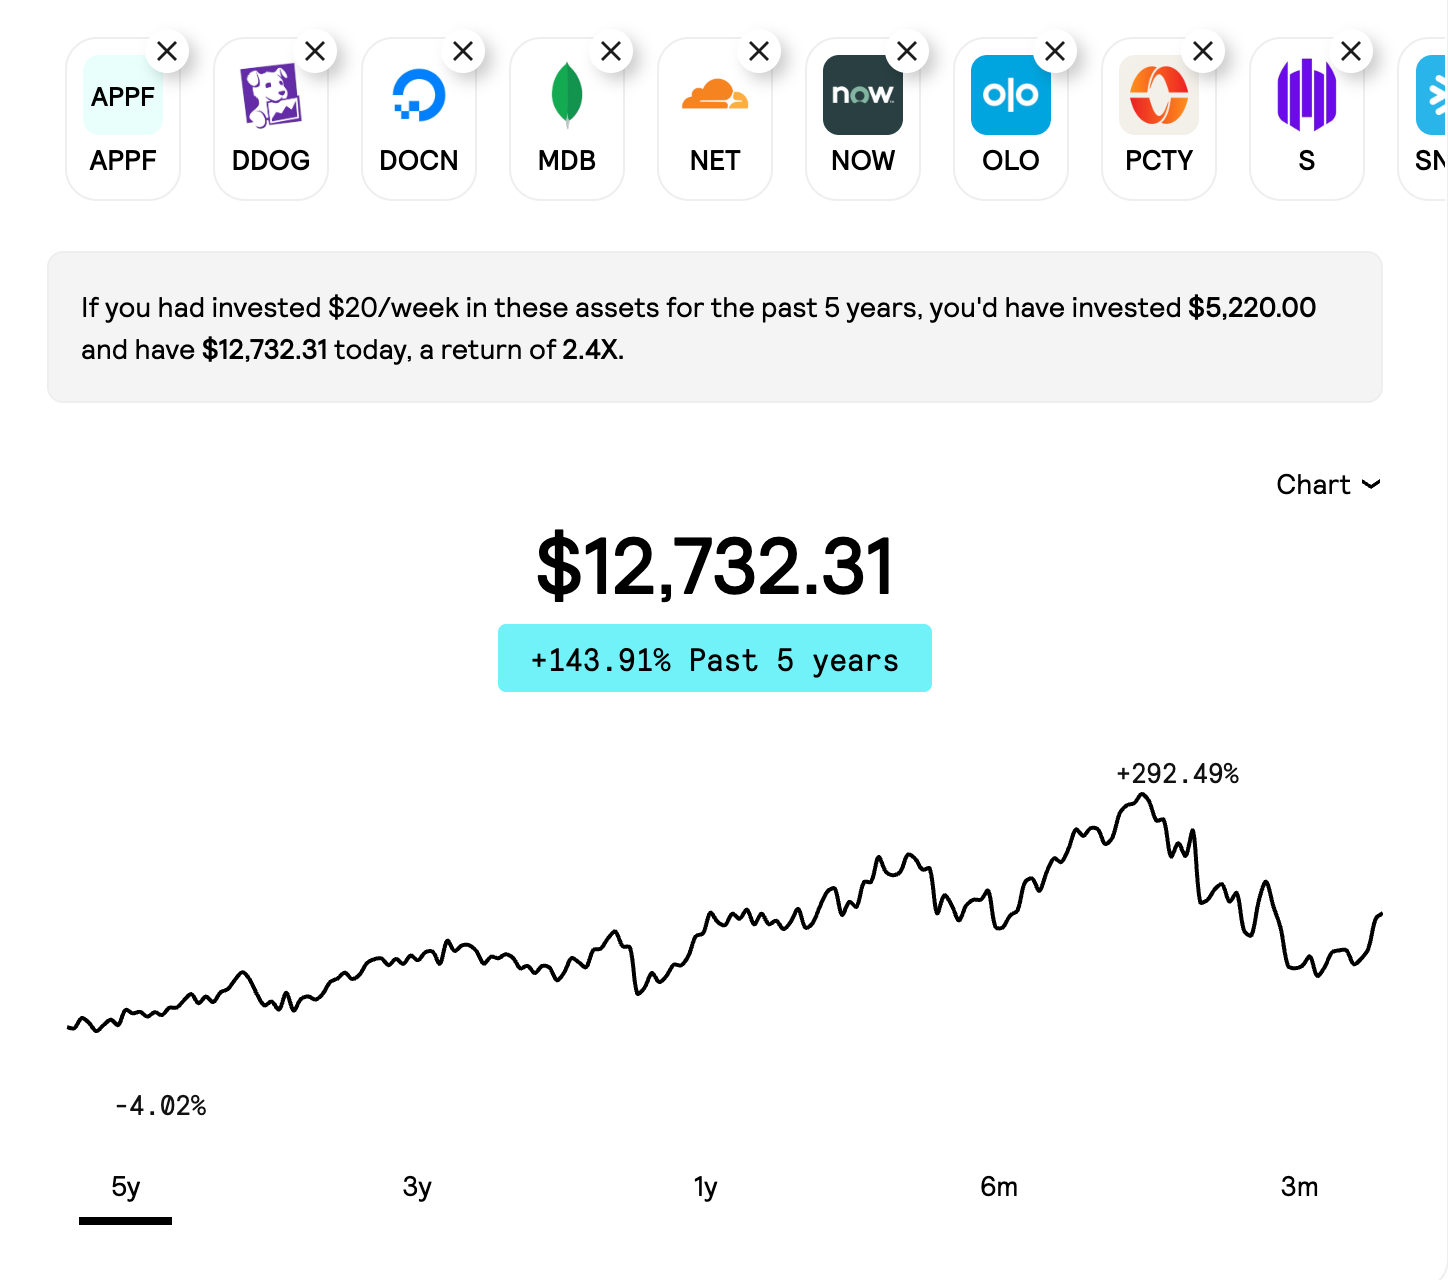
We thought it would helpful to experiment with different asset combinations and time periods, and see how dollar cost averaging would have worked out. That’s why we built the simulator - drag any combination of stocks you want and it will crunch the numbers for you as if you’d invested $20 weekly for up to 5 years. The possibilities are endless - you can mix different sectors or company sizes, experiment with diversification and different time horizons, and test your intuitions about investing.
It’s important to say that these examples are for illustrative purposes only, and are not investment advice. Past performance does not guarantee future returns, and recurring investments don’t protect against losses.
Assumptions
Every simulation has to make a few assumptions. We made the following ones.
You invest $20 once a week, on the Monday.
If you don’t invest on the Monday, because the market is closed, then you invest on the next available trading day. This will usually be a Tuesday.
You invest right when the market opens, and you get your orders filled at exactly the market open price.
You only buy and hold, you never sell (even if you’re way up).
Want to run your own simulations?
The simulator is available at simulator.tryshare.app. And if you want to start dollar-cost averaging (and you’re a US resident) download the Share App here to get started - it’s the easiest way to create recurring investments in groups of stocks.