

October's Top Performing Strategy 🏆
October's Top Performing Strategy 🏆
What a difference a month makes

Kareem here. I’m writing this a bit late, already 8 days into the month, but better late than never! If you recall, last month was a brutal month in the markets, with the only strategy to post a positive return being the Bear Case 🐻 strategy, also know as the “short everything” strategy.
October was very different. Almost everything up across the board, except for a few of the more speculative tech strategies (cough $META). It was a close race, but the top performing strategy was…. Oil & Gas 🛢️.
Before we jump into the discussion, an important disclaimer I have to mention is that this is an analysis of past performance. Past performance does NOT predict future returns (and in fact, could even make the stocks mentioned even more risky if they’ve seen a steep price rise in a short period of time). This analysis is for educational purposes only, and we’re not recommending any of the stocks discussed here.
Investing in oil and gas isn’t for everyone, but ultimately there is strong demand for energy, we need it to run the world, and prices have been steadily rising due to supply issues. Check it out below.
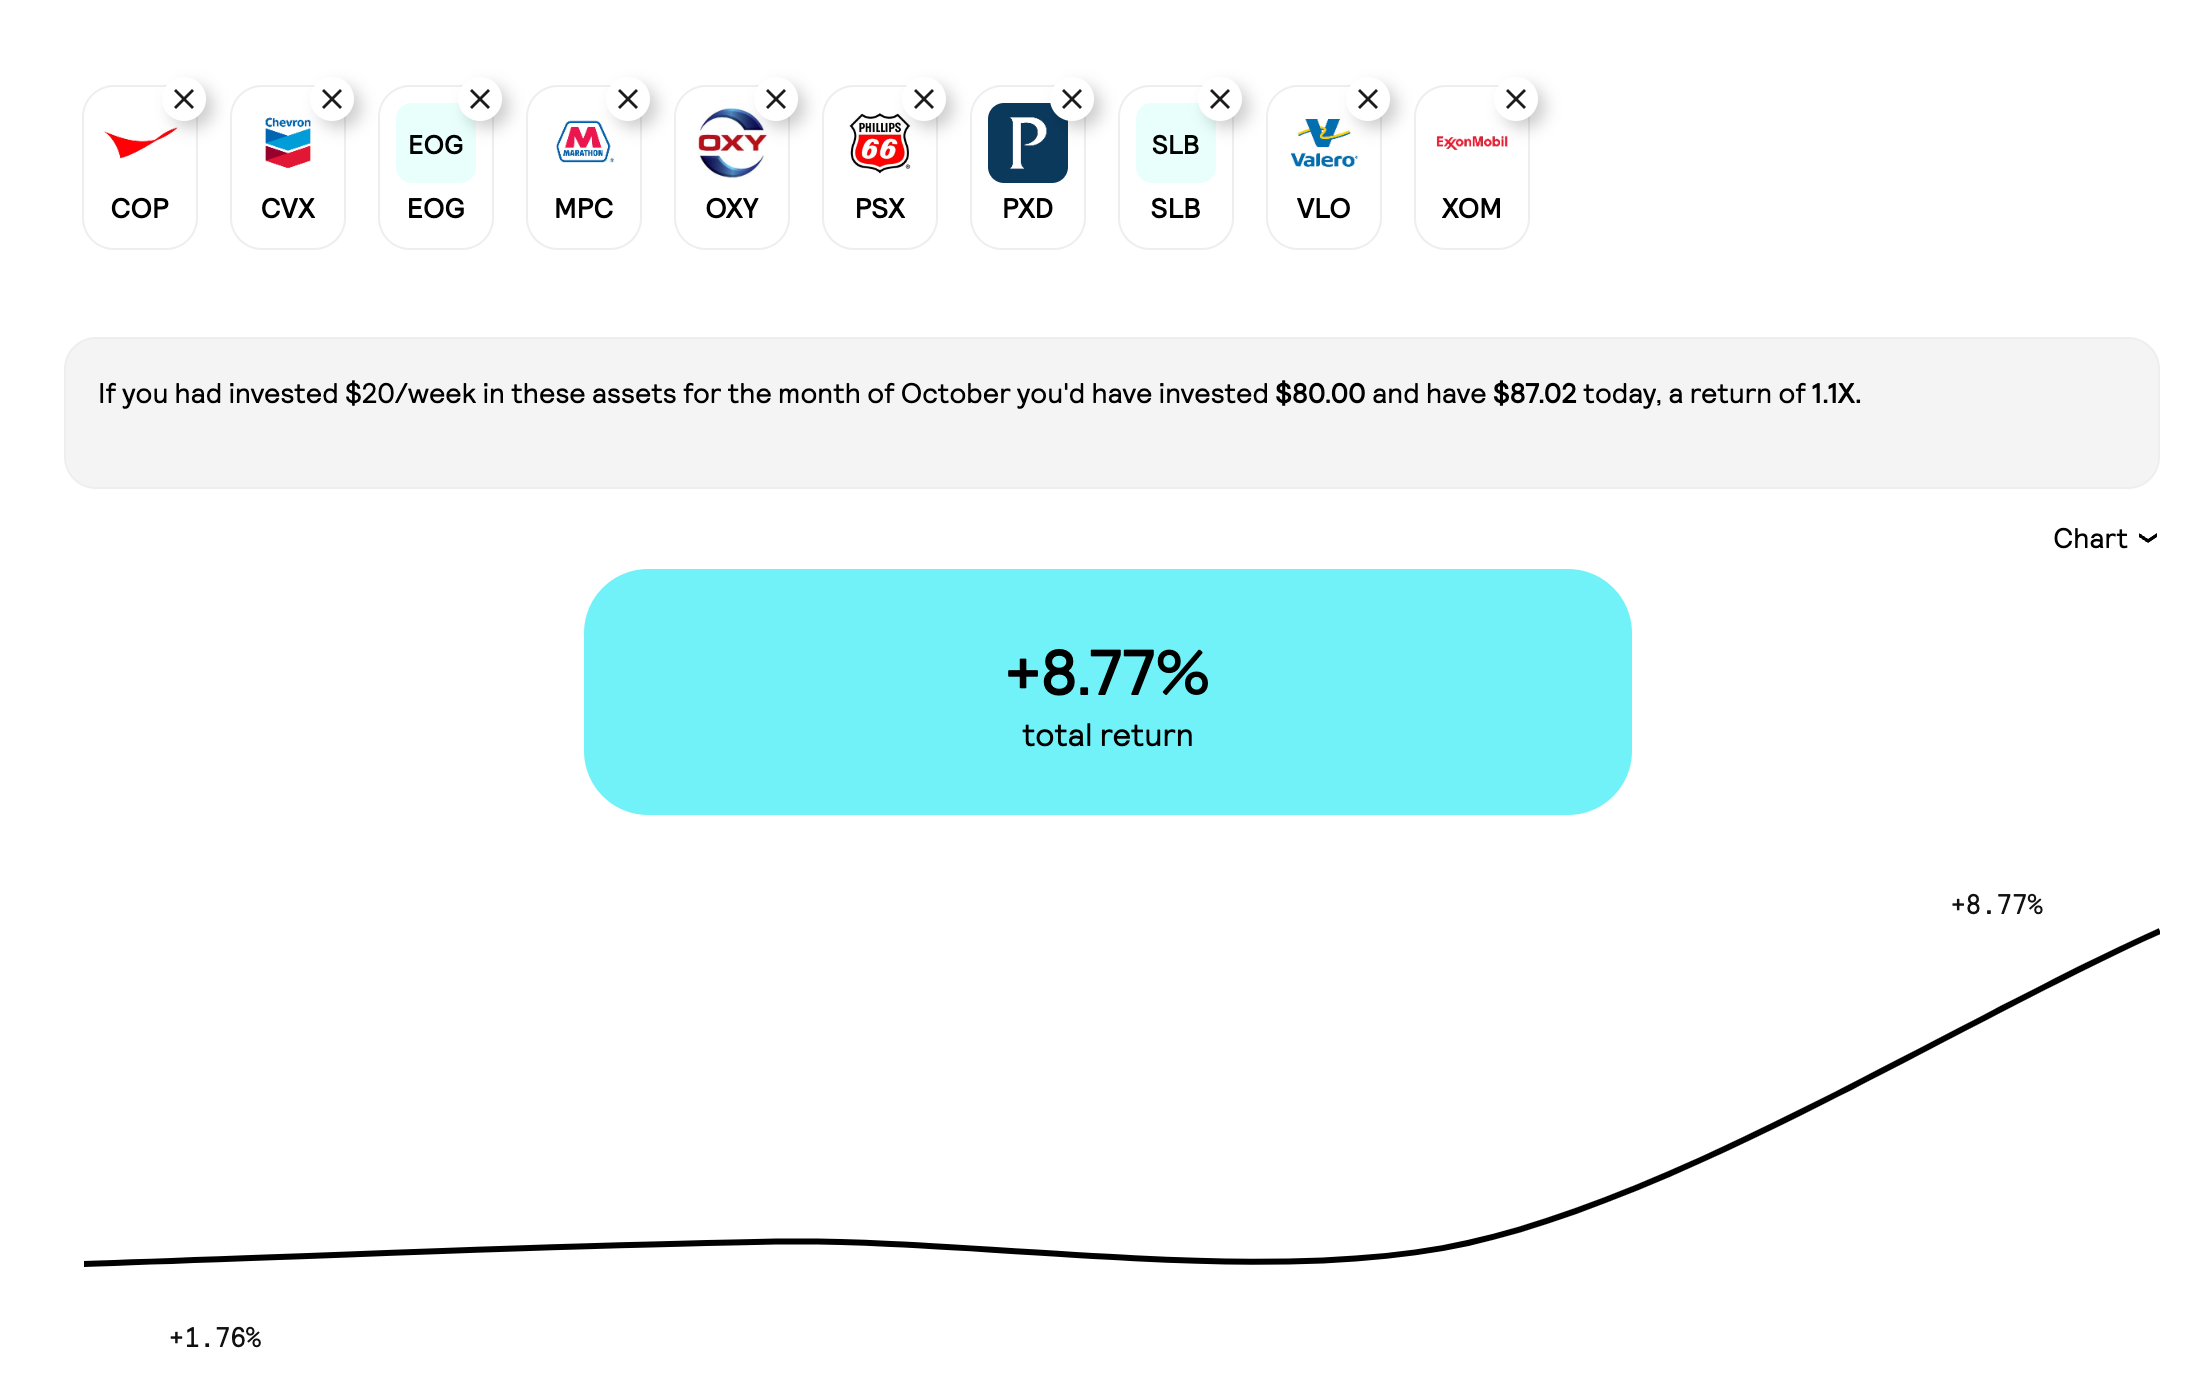
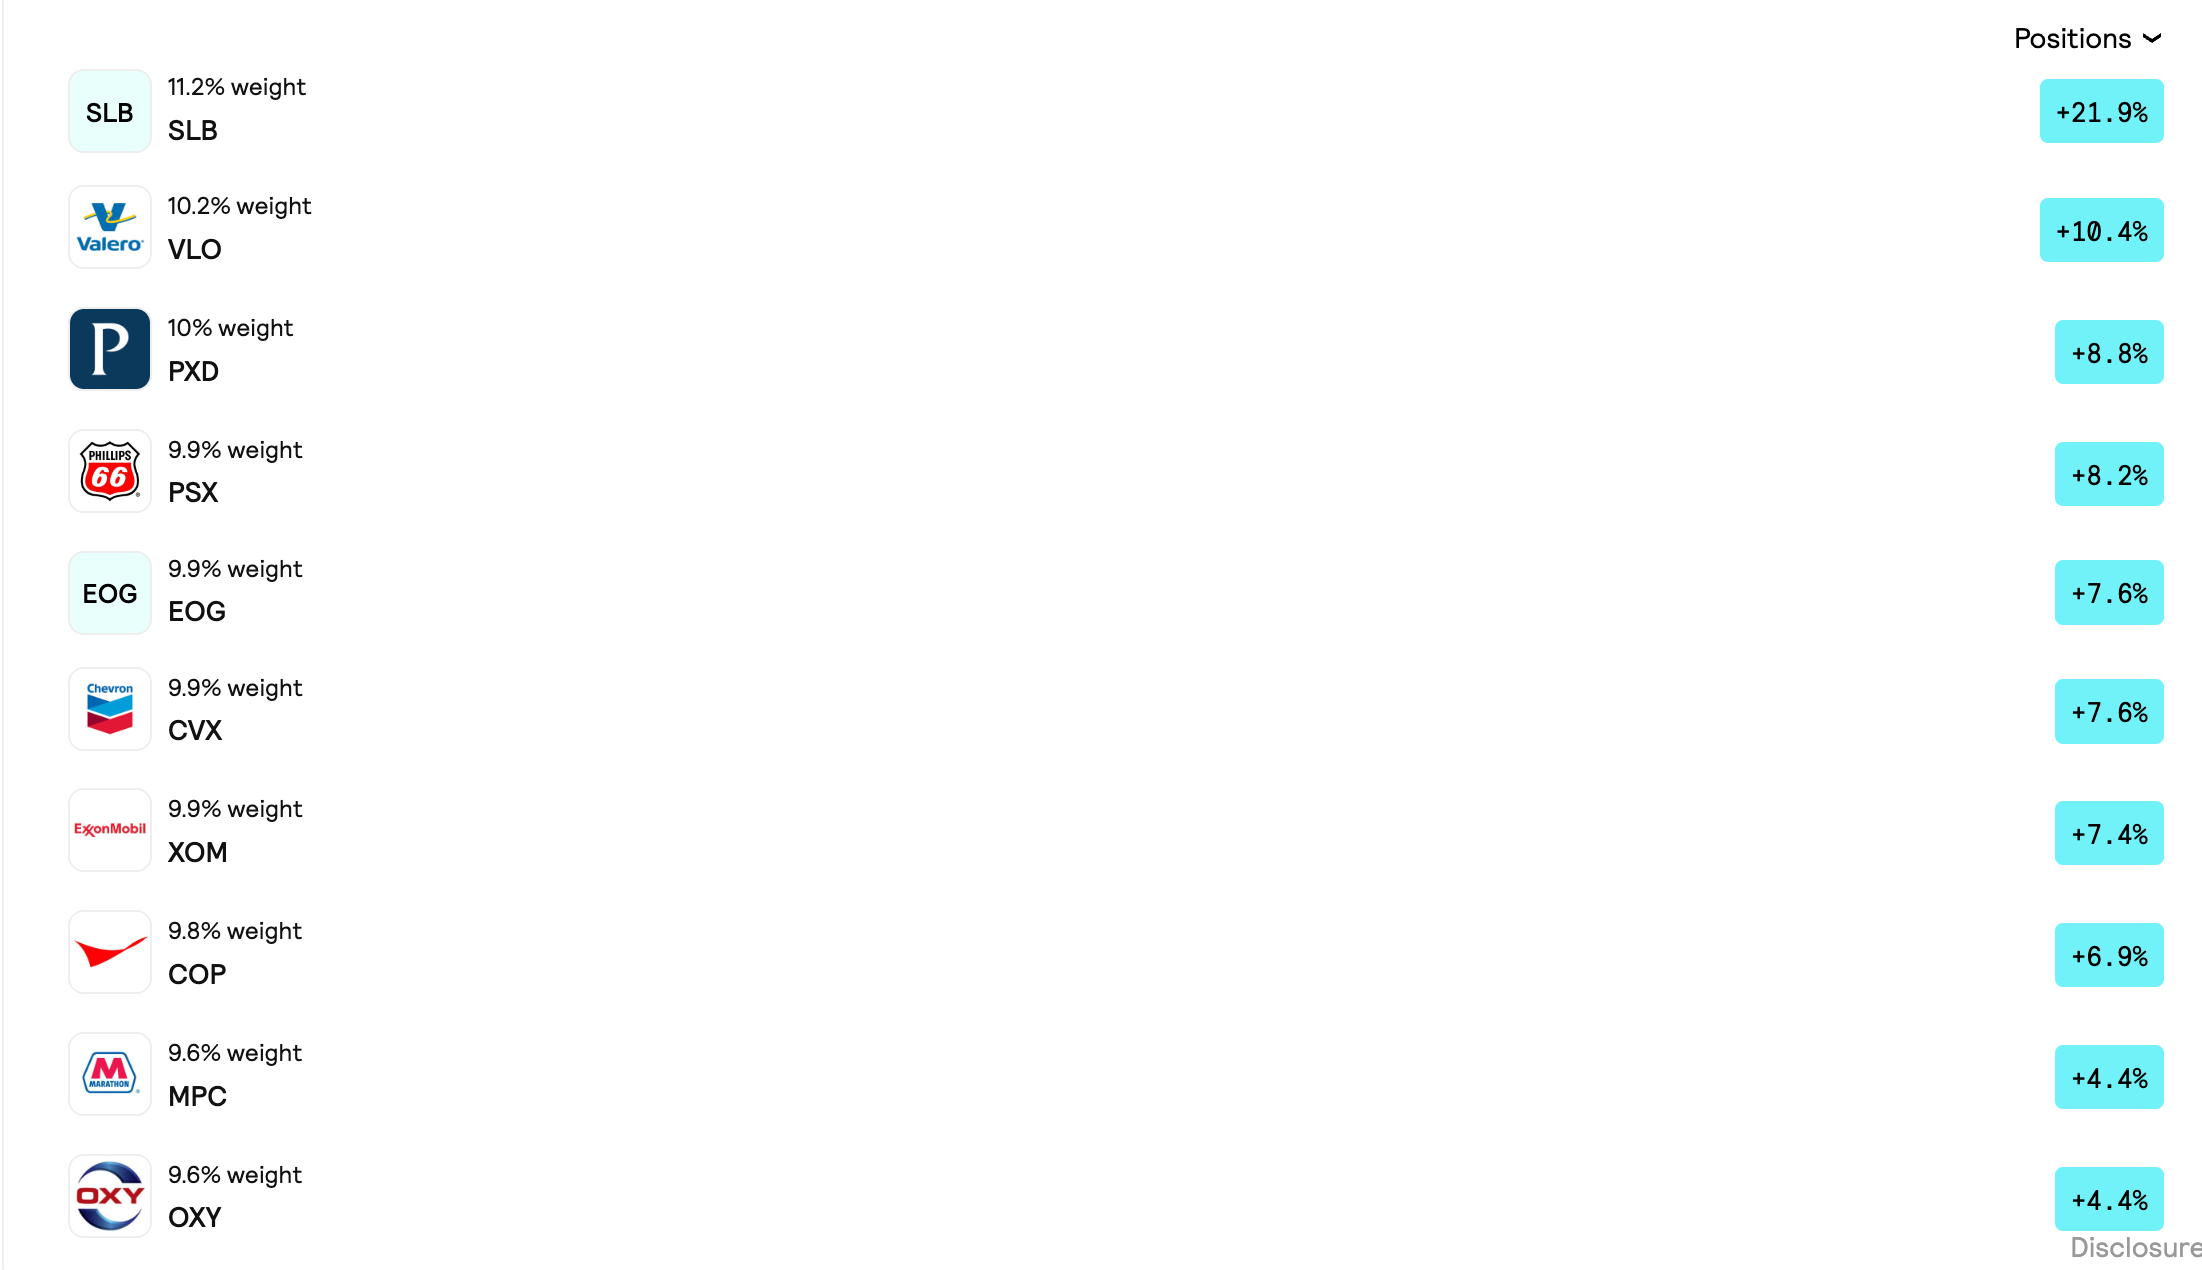
Diving into the individual stocks in the Oil & Gas 🛢️ strategy, we can see that they’re all up across the board.
This seems surprising at first glance, but checking out some of the other positively performing strategies in the month of October, like Data Driven 🗄️, Travel ✈️, or even Big Tech 🤖 they’re all showing the same behavior (everything, or nearly everything, delivering a positive return). So this indicates a broad market rally (or “beta” as the pros call it), not really anything special about these stocks, with the exception of a couple of outliers we’ll discuss in a moment.
The S&P 500 overall rebounded about 8% from its low point in October, so stocks returning between 4% and 10% are about in line with the market movements. That said, we can see that $SLB - the top performing stock in Oil & Gas above - is a 21% outlier. This is all the more impressive since our simulation is based on weekly investments throughout the month, not just a single investment at the start of the month. So let’s take a closer look at Schlumberger - a company that provides technology to the energy industry, founded in 1926 and based in Houston, Texas. Check out the chart below.
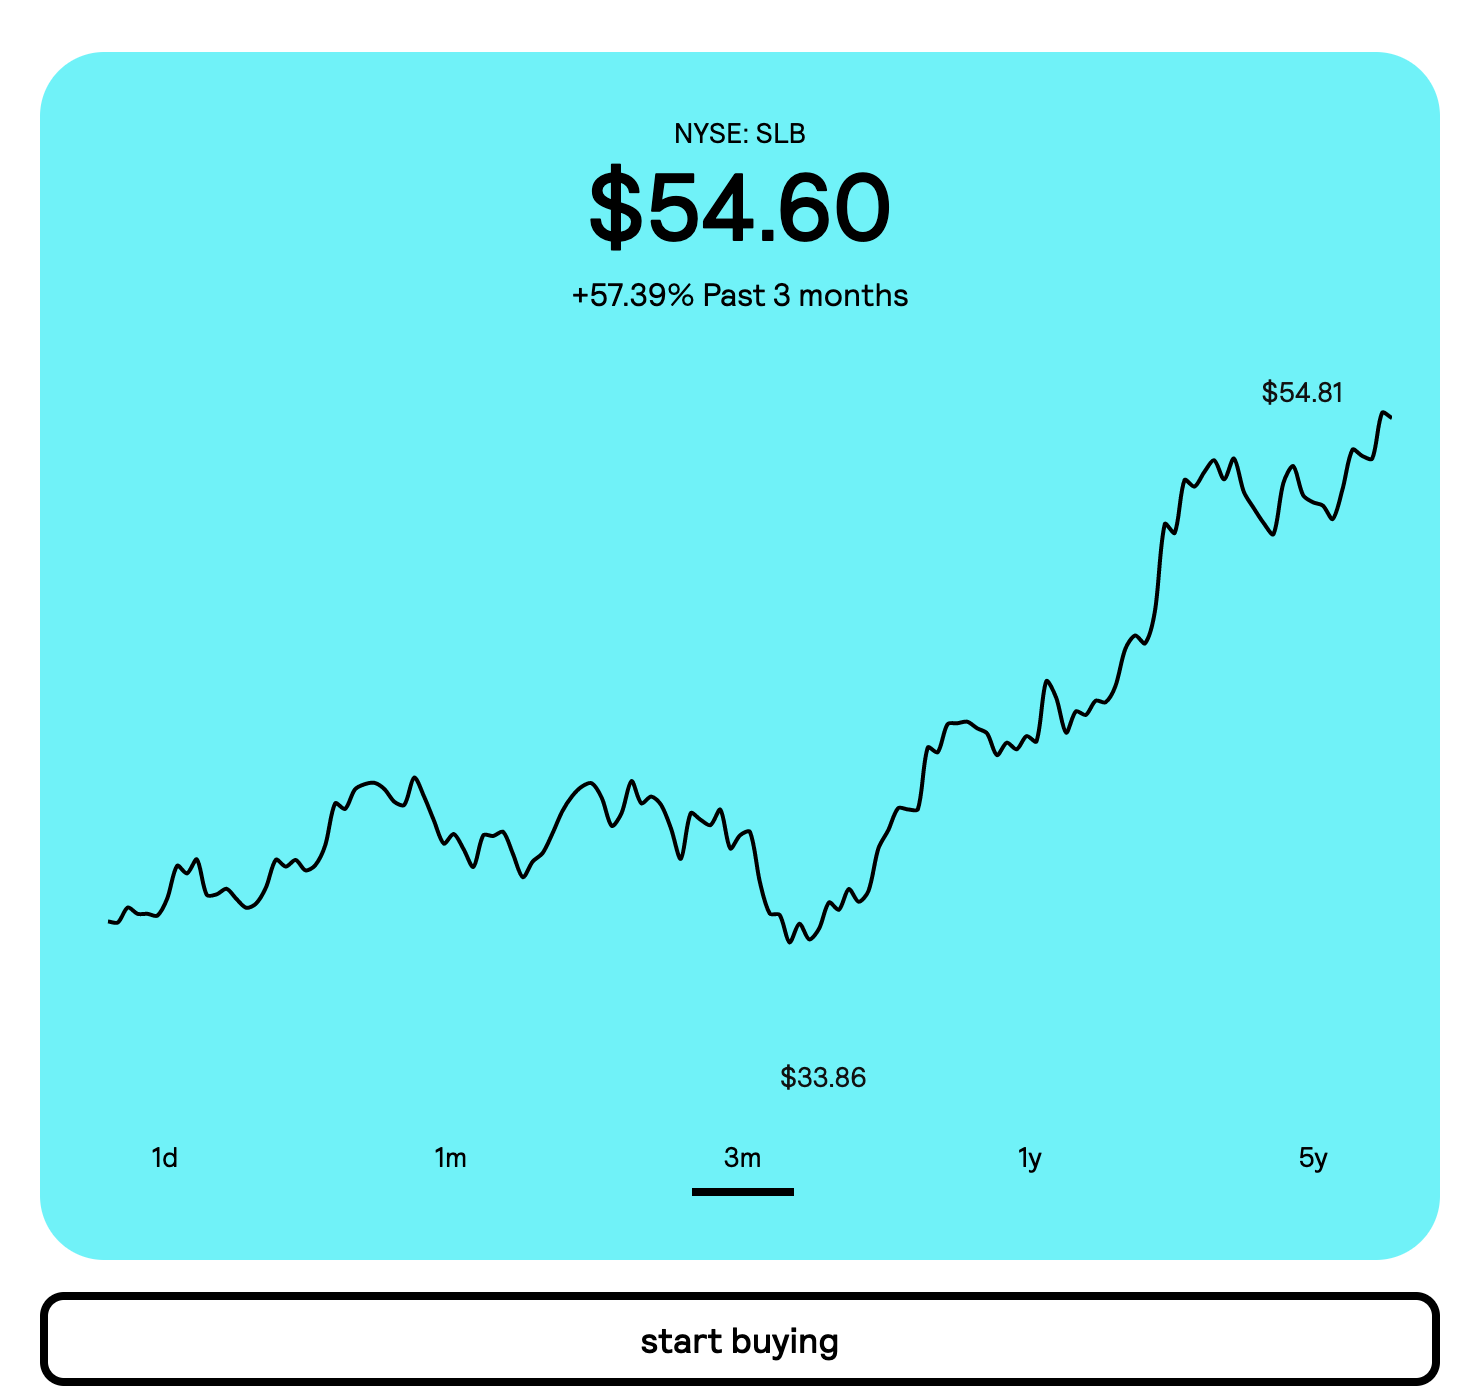
Looks like it’s been on a real run, up almost 60% in the past 3 months. Here’s the stats, as of November 2022.
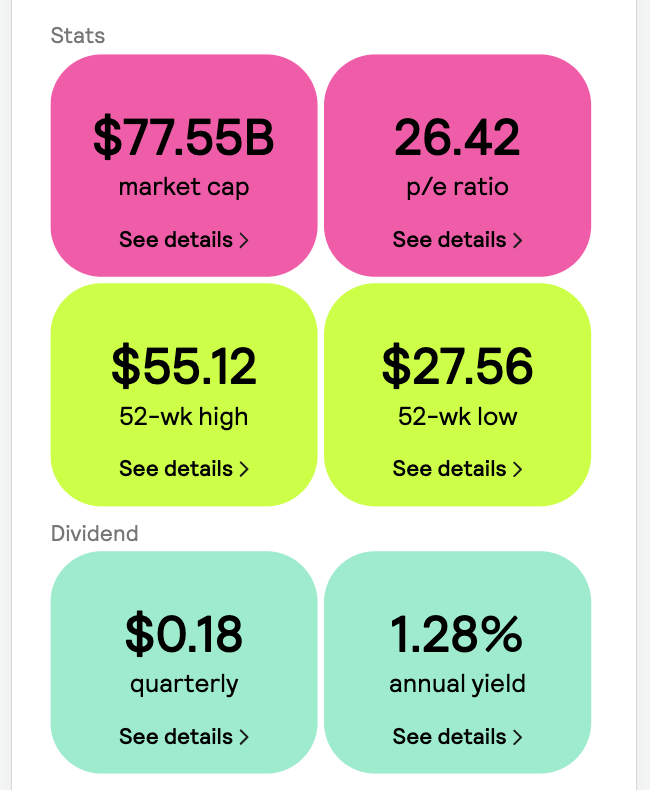
After that price run, the P/E ratio (P/E = price to earnings, or how many dollars you’d be paying for $1 of earnings in this company, at today’s price) is sitting at about 26. That’s pretty high. For example, Apple (is there a more beloved stock?) currently has a P/E ratio of about 22. So the market is currently valuing Schlumberger’s earnings even more than Apple’s.
Compared to oil and gas in general, this is even more surprising. The average P/E ratio in the Oil and Gas strategy on Share is 10.3, even including Schlumberger.
So what’s going on? Turns out, they posted their highest profit in 7 years and increased their revenue estimate for the remainder of 2022. A deep dive into Schlumberger’s business is beyond the scope of this newsletter, but it does illustrate one nice thing about the dollar-cost average into a bunch of companies in a sector approach; instead of trying to pick the one winner that’s going to smash earnings, invest equally across a bunch of companies. Sure, you’d have had a better return if you invested only in Schlumberger, but the odds of identifying that one stock as the big winner of 2022 are pretty slim.
That’s all for this month, thanks for reading. We’ll be back next month with another look at a strategy. In the meantime, if you want to start doing recurring investments in this strategy or any others, join us on Share.
p.s. did you know we have a Slack community? join us to share product feedback, hear about new features before they come out, and learn about investing